Employability and careers
Destinations
Destinations
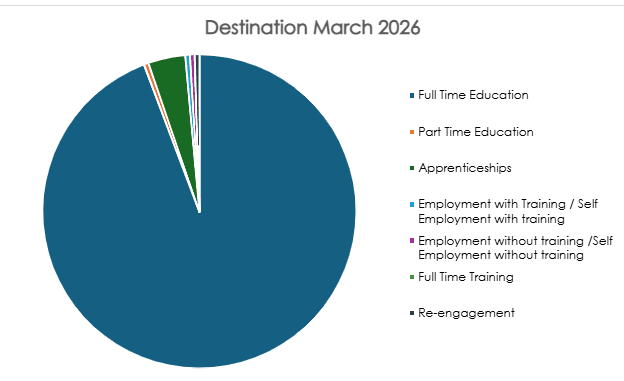
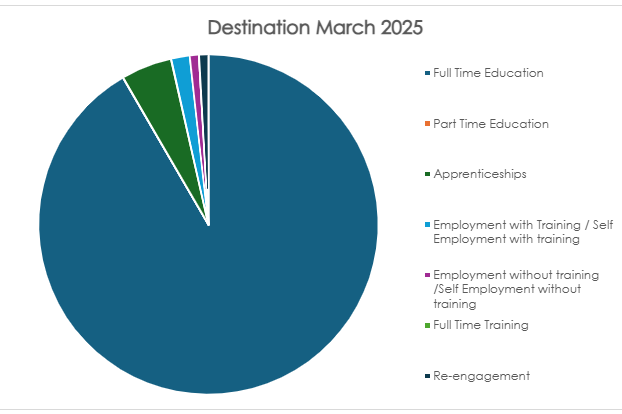
We are proud that our careers provision provides our young people with accurate unbiased information to enable them to make informed choices regarding their future pathways. This is shown in our sustained outcomes in our destination data which continues to show positive trends well above local and national averages. Our last five years destination analysis is shown below.
| Destination | 2026 | 2025 | 2024 | 2023 | 2022 | 2021 |
|---|---|---|---|---|---|---|
| Full time education | 92.5% | 90.8% | 90.8% | 91.5% | 91% | 92.7% |
| Part time education | 0.5% | 0% | 0% | 0% | 0% | 0% |
| Apprenticeships | 3.8% | 4.8% | 4.4% | 4.7% | 6.2% | 4.4% |
| Employment with Training / Self Employment with training | 0.5% | 1.7% | 1.7% | 1.9% | 0.5% | 1.9% |
| Employment without training /Self Employment without training | 0.5% | 0.9% | 0% | 0% | 0.5% | 0.5% |
| Full Time Training | 0% | 0% | 0% | 0% | 0% | 0% |
| Re-engagement | 0.5% | 0.9% | 3.1% | 0.9% | 0.5% | 0% |
| Settled Outcomes | 98.1% | 99.1% | 100% | 99.1% | 98.6% | 99.5% |
| NEET Actively Seeking | 0.5% | 0.9% | 0% | 0.9% | 0.5% | 0% |
| NEET not Active | 1.4% | 0% | 0% | 0% | 0% | 0.5% |
| Not Settled Outcomes | 1.9% | 0.9% | 0% | 0.9% | 0.5% | 0.5% |
| Moved out of contact | 0% | 0% | 0% | 0% | 0.9% | 0% |
| Current situation not known /refused | 0% | 0% | 0% | 0% | 0% | 0% |
| Total Outcomes | 100% | 100% | 100% | 100% | 100% | 100% |